Artezio Burndown Chart for JIRA
The plugin for JIRA is designed to build two types of charts: burn-down chart and burn-up chart.
With the help of the charts, it is possible to track the dynamics of work performance by the selected set of issues, dynamics of changes in the remaining estimate as well as make visual comparison of the real dynamics with the expected ideal dynamics.
With the help of the charts, it is possible to track the dynamics of work performance by the selected set of issues, dynamics of changes in the remaining estimate as well as make visual comparison of the real dynamics with the expected ideal dynamics.
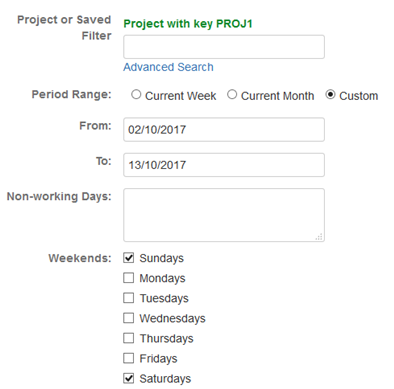
Data filtering configuration
- A filter with issues on the project or using the previously saved filter
- A time interval to build charts
- Recording non-working days and day offs
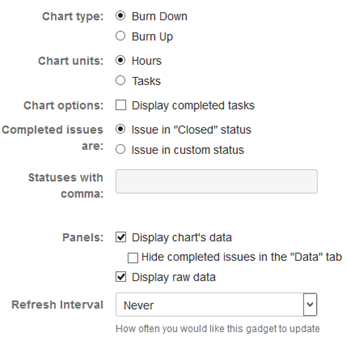
Display Configuration
Chart configuration:
- Select a chart type: burn-down/burn-up
- Select chart units: hours/tasks
- A bar chart with completed issues or issues in set statuses
Gadget configuration:
- Additional panels (table or text data display)
- An interval of automatic updates
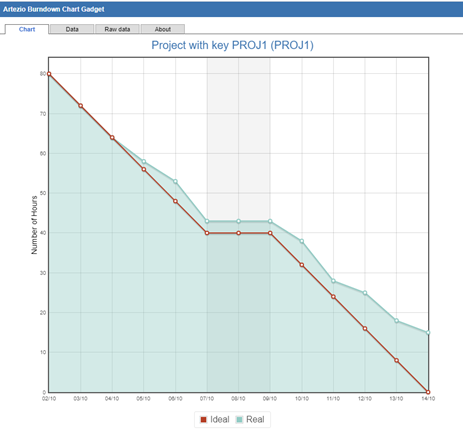
Jira Burn-down chart (hours)
Chart configuration:
Displaying the real and ideal dynamics of “burning down” hours allows estimating how far a team is behind or ahead of the schedule.
On all charts, when you hover the mouse, numerical values are displayed at the specified point.
Burn-up chart (hours)
Displaying the dynamics of work performance allows monitoring changes in the speed of work. Displaying changes in the estimation of the task complexity allows tracking how much the total scope of work has changed during the time interval.

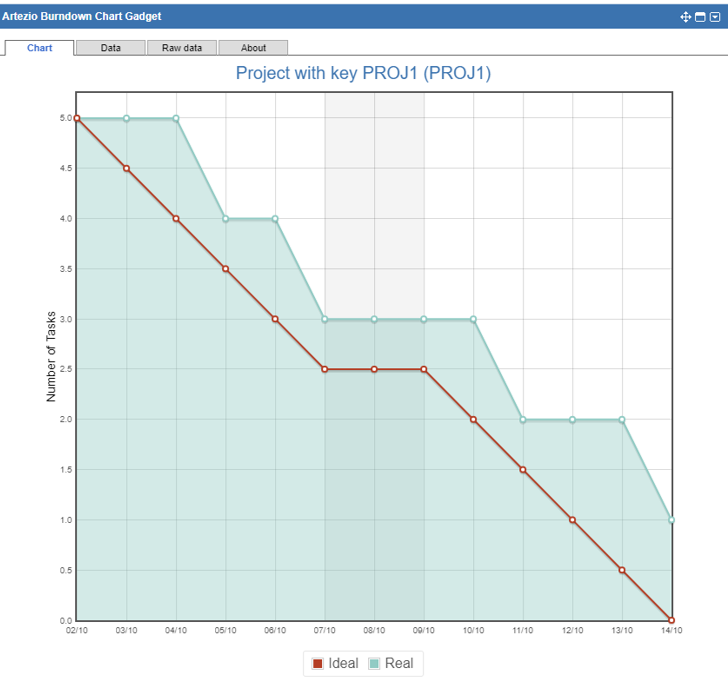
Burn-down chart (tasks)
When changing units (the Chart units setting), burn-up or burn-down charts will be displayed for tasks and subtasks.
Displaying the real and ideal dynamics of tasks and subtasks completion on a burn-up chart allows estimating how far a team is behind or ahead of the schedule.
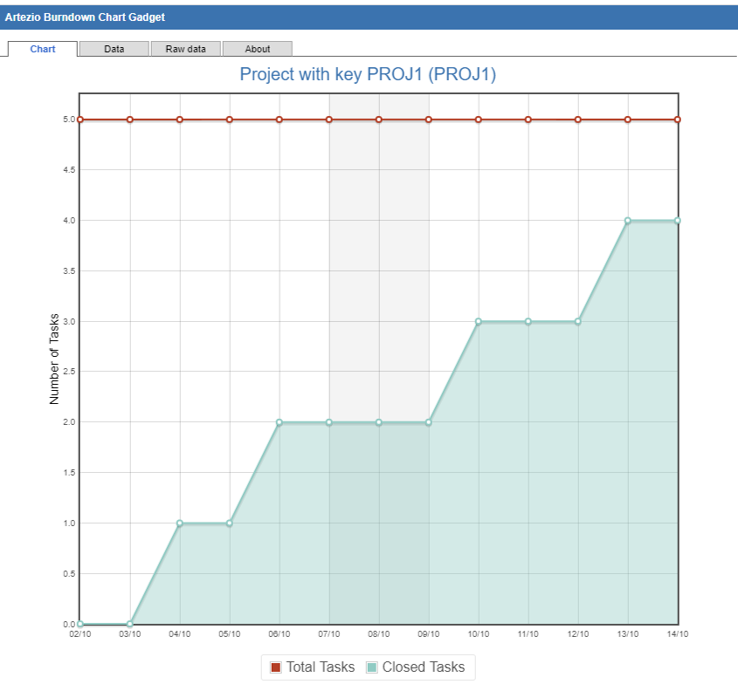
Burn-up chart (tasks)
Displaying the real and ideal dynamics of task completion on a burn-up chart allows monitoring changes in the speed of work.
Displaying changes in the total amount of tasks allows tracking when and how many tasks have been added during the selected interval.
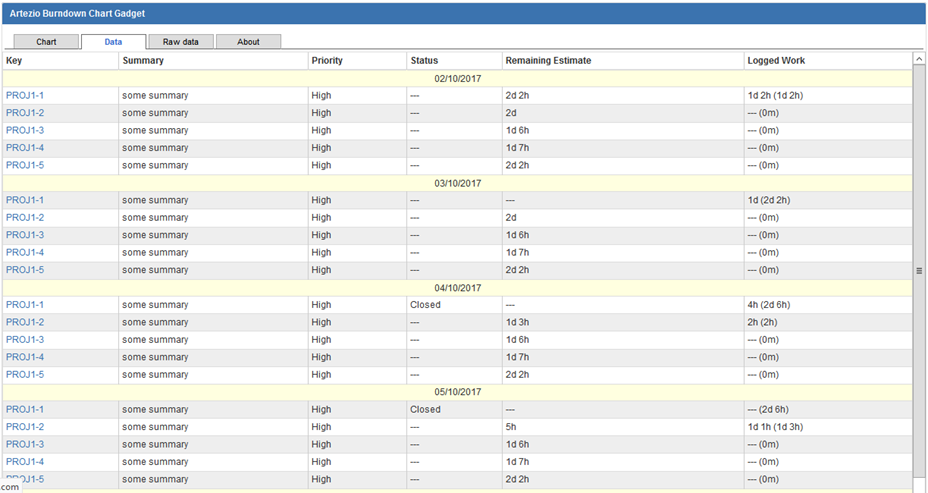
Table Data Display